


Gokaldas Exports: Weaving it's way for the Tailwind

Indian Textile Sector Overview
“vestis virum facit” meaning “clothes make the man”
The above-mentioned phrase coined ~400 years ago underscores the everlasting obsession that we have with what we wear and how we wear. The apparel fashion industry is one of the oldest but has been reinventing itself at a constant pace, defining fashion trends over time. The same, however, cannot be said about Textile and Apparel (T&A) manufacturing. This vintage sector that has been a part of several industrial revolutions across countries has witnessed only a few path-breaking product innovations over time.
With the process innovations being minimal, the industry has always been labour intensive which has prompted the T&A production to migrate towards countries that have lower labour and manufacturing costs. China has been dominating T&A production since the 2000s. However, the emergence of other low-cost centers such as Bangladesh and Vietnam has reduced the relevance of China. India, one of the key T&A production hubs, has always had the advantage of cheap raw material (cotton) availability.
Being, brought up in a textile family and living in the textile hub of the nation or the Silk City of India. That led me to research this sector. No bias was involved in this report. According to Maslow’s hierarchy theory, clothing is a basic and fundamental need. But the industry working is quite different according to what the theory describes. This report aims to outline the same.
Apart from the supply chain re-alignment or ban on China, one more emerging trend is clothing is massively underutilized. Customers purchase more clothing than they will use and are quick to switch garments after use. Worldwide, clothing utilization – the average number of times a garment is worn before it ceases to be used – has decreased by 36% compared to 15 years ago. This is known as the fast fashion trend.
Clothing Sales v/s Decline in Clothing Utilisation

In December 2021, The U.S. President signed into law legislation that bans imports from China's Xinjiang region over concerns about forced labour. As Xinjiang constitutes ~20% of the global cotton market, the supply readjustment on account of this ban has led to more demand for Indian Cotton and Cotton yarn. Cotton and Cotton yarn exports from India have surged at a ~34% CAGR (between April and October) from FY19-21. The USA market is ~15% of the global T&A imports making it one of the key consumers of the global T&A trade.
The USA market is ~21%, ~15%, and ~32% of the Knitted RMG, Woven RMG, and Made-ups imports which makes this ban more profound on garment manufacturers. Countries such as China, Bangladesh, Vietnam, and Cambodia have become reliant on India for their cotton requirements post the ban leading to Indian cotton exports.
Skyrocketing in the past 8 months. We note that the contribution of yarn has increased among the total cotton exports indicating that countries that have low spindle capacity such as Bangladesh, Sri Lanka, and Cambodia are increasingly picking up cotton yarn from India. We see the cotton players in India enjoying more exports. The fact that Indian yarn is still cheaper than the global prices indicates the underlying global demand.
Indian Textile Sector – Indian Spinners leading the turnaround

The factors that should lead to a rise in domestic apparel consumption
E-commerce leading to higher offtakes
Younger demographics' quicker wardrobe turnarounds
Resumption of offices/schools should lead to higher woven demand
Price Inflation leading to better realizations
Increased demand for knit clothing on account of WFHs
Technology leading to the faster adaption of fashion trends
Apparel regaining their lost wallet share
Salary hikes lead to higher consumer spending on apparel
The factors that should lead to India gaining share in the international textile market
‘China Plus One has led several western countries to look at alternate markets
Better availability of skilled manpower in India.
The trade tension between US-China led to higher import duty on Chinese apparel.
Government Initiatives such as PLI and others.
The ban of cotton from the Xingjiang region should benefit Indian cotton yarn exporters
Probable Free Trade Agreements
India’s right to win in the Made-Ups being the 2nd largest
Given the sourcing advantage, vertically integrated players should gain more tractions
What are the other incentives that the government is providing to the sector?
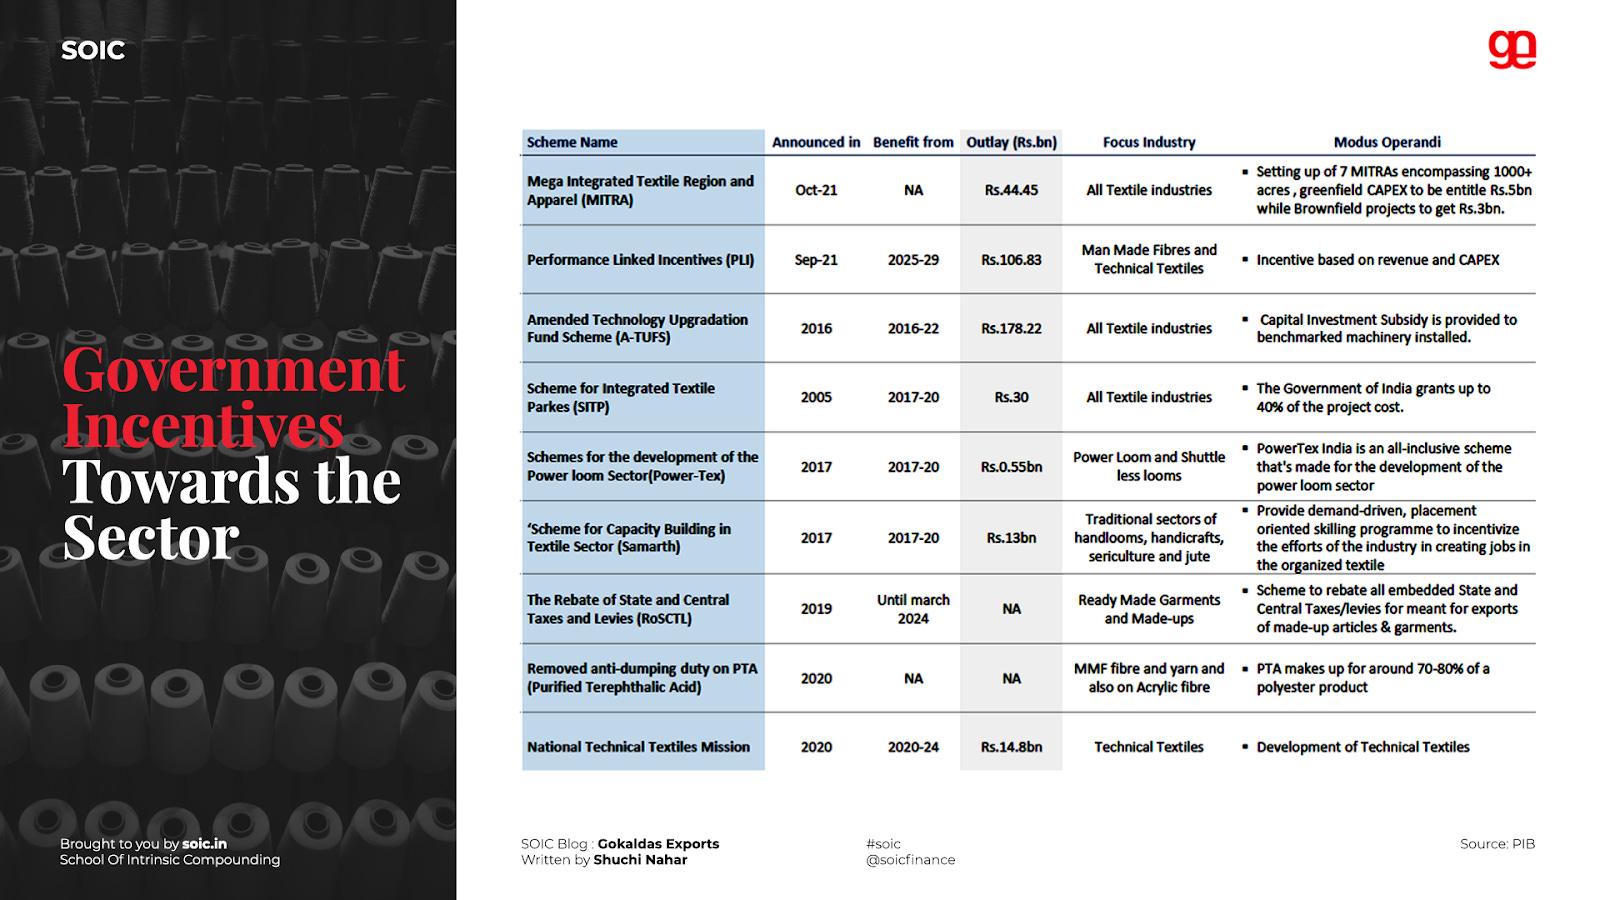
MITRA and PLI should drive industry CAPEX. Extension of A-TUFS, a competitive RODTEP and RoSCTL scheme to enable the producers to be cost-competitive.
Now let’s understand the textile sector value chain
Let’s do a detailed analysis of how the industry functions and get the crux of which aspect of the value chain holds the most value and can provide us with great returns. Generally, In India, there is no single company that has invested in the entire value chain from yarn to fabric to apparel. It becomes more interesting to find out where the treasure lies and with whom.

Cost Competitiveness

De-risking supply chain from China or China+1 strategy
China’s share is expected to come down in the global trade China lost 8% share in the US apparel market in CY2020. India witnessed a flat trend, while Vietnam, Bangladesh, and Cambodia increased their share by 4%, 2%, and 2%, respectively (Source: OTEXA, US).
India has been able to take away business in some parts of the value chain from China quite a bit now and will continue to do so as costs in China are going up. Centrally, the government has realized the reasons why Indian companies in the apparel sector haven’t been able to compete in the global markets.
Any measures/policies on this side will significantly change the business environment for these companies. As demand picks up, India is expected to be in a stronger position to become an alternate supplier to China.
Textile Value Chain

The different industries involved in the conventional value chain for polyester apparel are summarized in the above figure. The value chain begins with the oil industry, which extracts and refines the crude oil to generate building blocks used by the chemical industry to produce PET and other chemicals (additives).
The chemical industry then supplies PET pellets or chips to the textile industry, which converts the pellets into fibers by extrusion and spinning, and then into fabrics by knitting or weaving. This process also involves the incorporation of dyes and additives to impart qualities to the fibers and fabrics. Finally, the clothing industry cuts and sews the fabric into garments and makes them available in retail stores.

The market is expected to recover and grow at 10% CAGR from 2019-20 to reach US$ 190 billion by 2025-26. Apparel constitutes ~73% share of the total T&A market in India.

India’s exports of T&A are expected to grow to US$ 65 billion by 2025-26, growing at a CAGR of 11%.
From all the above discussion we can conclude that these are the specific area that holds the utmost treasure of growth -
Spinning business/ Backward or Forward Integrated player is a preferable play or; -Organized -Export Market Share is amongst the highest -Large player enjoy better control over the supply chain and are able to mobilize working capital better -can command an additional premium for value-added service resulting in improved margins
Exports or -US markets are stronger -China +1 strategy -Re-aligning supply chain
Home Textiles (Exports) -India has a good market share.
Apart from the above-mentioned criteria, while analyzing the industry we realized that every industry must be analyzed in a different way.
Till now, one criterion before investing was to find if the company has a sustainable competitive advantage over its peers. But the parameter changes with every industry. For instance, textile is a very management-intensive industry.
The Indian Textile Industry is expected to grow at a CAGR of 10% in the next 5 years. On the other hand, the growth rate of global textiles is low. Some part of the growth for Indian companies will come from gaining market share.
Understanding the business dynamics, comprehended that it is important to find a company in the organized space which could gain market share when the cycle upticks.
Moving forward here is the company which manufactures one of the famous and most likely international brands such as “H&M” & “GAP”.
Company Overview
Gokaldas Exports is one of India’s leading apparel exporters with an annual capacity of 36 million+ pieces. GEL focuses on manufacturing complex garmenting products that insulate it from other price-based competition.
The impressive clientele of leading international brands with ‘GAP’ and ‘H&M’ being major contributors to revenues. The US contributes ~80% of sales. Under the leadership of the new MD (post exit of Blackstone in FY18), GEL has scripted a successful turnaround of its business operations.
The order book for spring production (Q3FY23E) is at reasonable levels. It could witness flattish growth. Excess spring-summer inventory at the retailer’s level (major US retailers) could slacken the tempo of order flows in H2FY23. It charted out a CAPEX of 350+ crore over the next three years, which will have the potential to generate incremental revenues worth ~1300 crore.
With the recent fundraising in 2021 (QIP - 300 crore), the company has strengthened its balance sheet with repayment of ~300 crore debt, post which GEL has become net debt free (net cash surplus: 369 crore).
Enhanced government focus on apparel exports and China +1 strategy of global brands provides a long-term growth opportunity for players like GEL.
Established market position and a long track record in the apparel industry – Company’s healthy scale provides its operating flexibility in an intensely competitive industry.
The company has a strong business profile with a presence across the manufacturing value chain and recorded a revenue of Rs.1800 crores in fiscal 2022. Further, it also benefits from the management’s expertise regarding the understanding of market dynamics, and healthy relations with customers, suppliers, and other stakeholders which will continue to support the business.
Gross current assets were at 125-151 days over the three fiscal ended March 31, 2022. Its working capital management is reflected in its gross current assets (GCA) of 129 days as of March 31, 2022, as against over 151 days GCAs of some of its peers. GEL enjoys established relationships with reputed global apparel retailers in the markets of North America and Europe, coupled with recurring orders received and a steady increase in wallet share with key customers.
Well-established customer base along with geographical diversification in revenues. Gokaldas has long-standing relationships with its customers and suppliers. Its customers include some of the reputed global apparel retailers in the markets of North America and Europe. GEL caters to a wide number of clients overseas and the top 10 customers generate revenue of about 90% in fiscal 2022. Over 90% of its revenue has been from exports. Diversity in geographical reach and clientele should continue to support the business risk profile of the company.
GEL’s capital structure has been strong with limited reliance on external funds yielding gearing of 0.08x and total outside liabilities to adj. tangible net worth (TOL/ANW) of 0.69 for the year ending on 31st March 2022. The infusion of funds worth Rs.300 crore in October 2021 through qualified institutional placement has improved the financial risk profile of the company.
GEL’s debt protection measures have also been strong with interest coverage and net cash accrual to total debt ratio being healthy at 5.1 times and 2.8 times for fiscal 2022. GEL’s debt protection measures are expected to remain at a similar level over the medium term.
The company has a strong diversification within the CAP ecosystem with three brands, there Old Navy, GAP as well as Banana Republic.
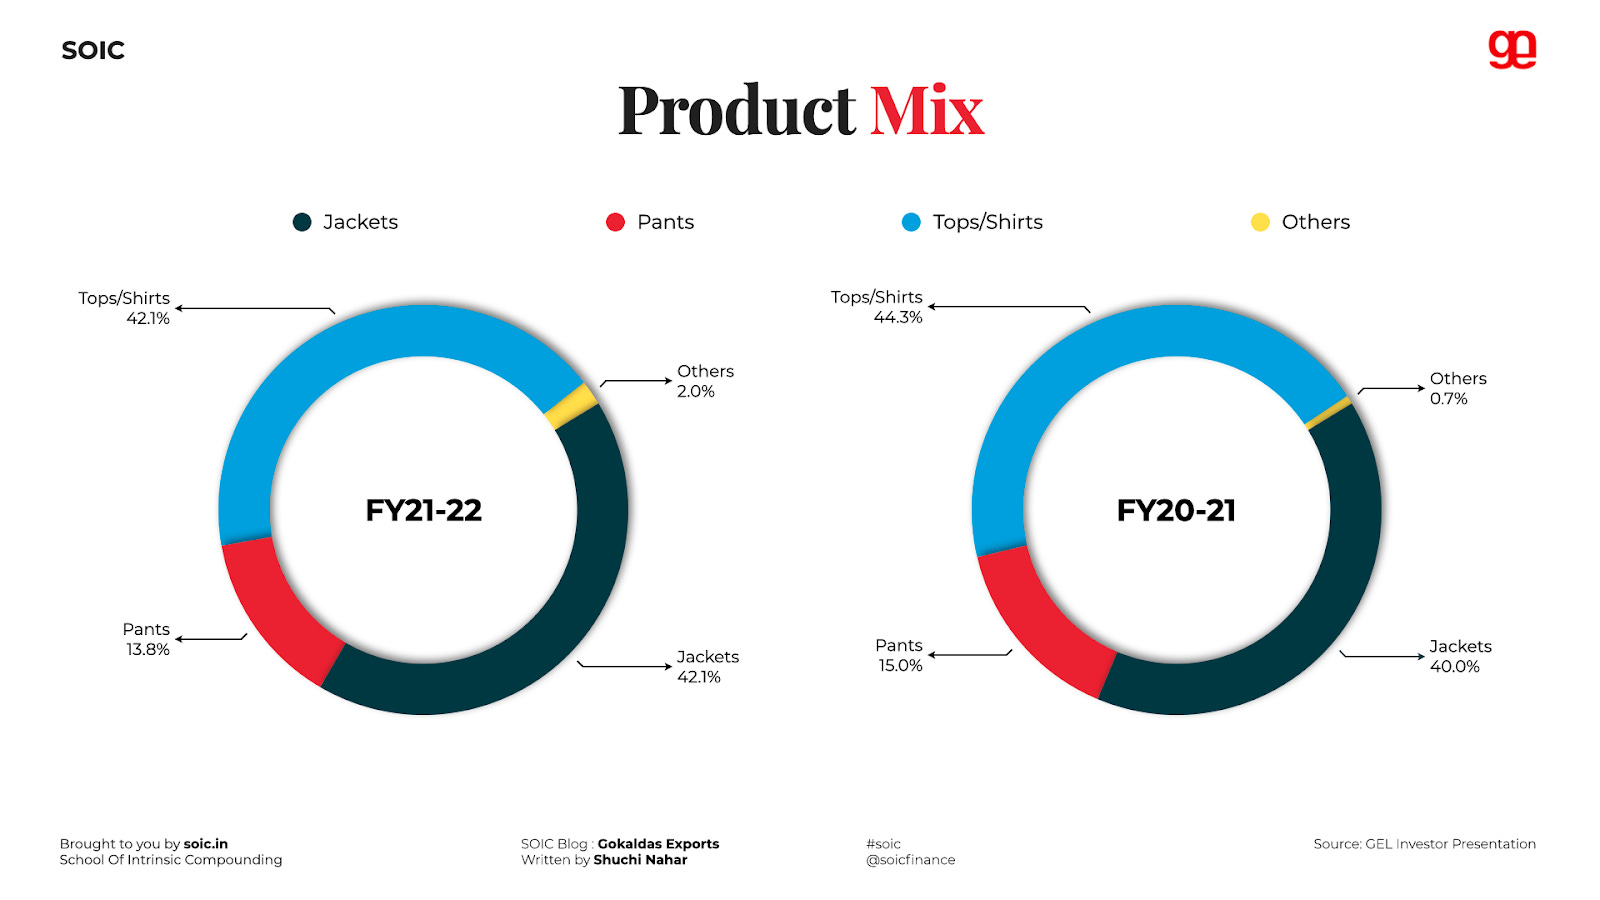
Product category sales
Steady growth in the outerwear segment helped balance the seasonality of the business. The drop in sportswear contribution in FY21 was due to reduced demand from key customers. It has since picked up in FY22 and is further expected to rise in FY23.

The number of pieces shipped
Growth in volume coupled with the increase in average realization per piece enabled a strong revenue growth in FY22. Volumes in FY21 were impacted due to pandemic-driven order cancellations.

Sales contribution basis ASP
Witnessed higher contribution from high ASP products in FY22. The sales contribution is shown with reference to the average price per woven garment exported from India.

Planned Capital Expenditure
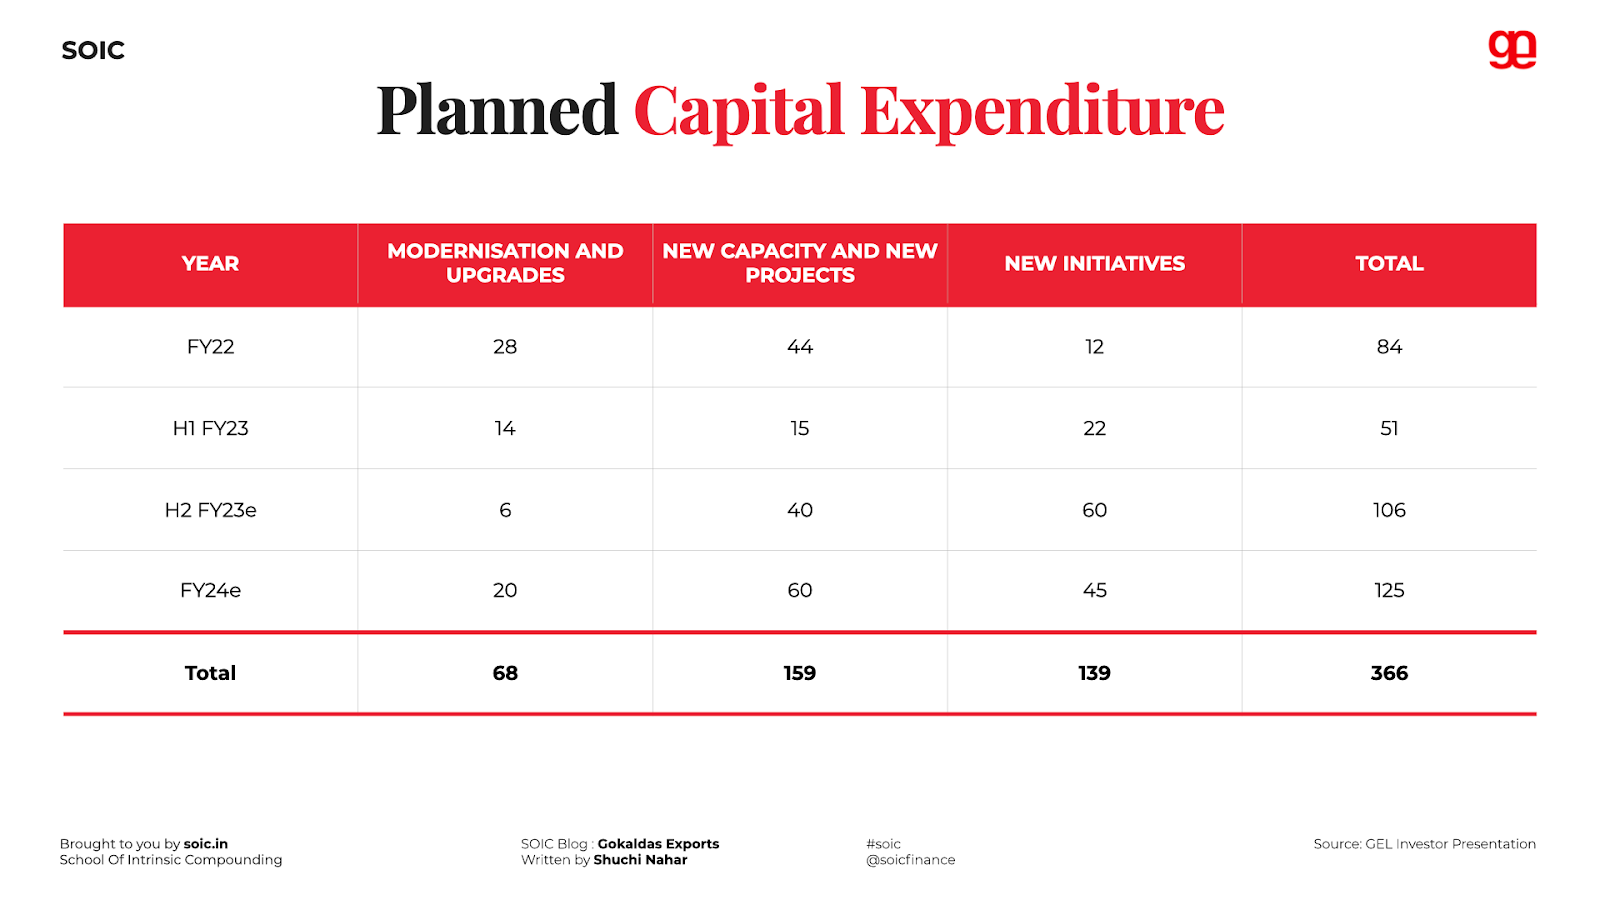
In H2FY22, GEL had set up two units in Karnataka (Tumkur, Bommanahalli), which has a potential annual revenue of 160 crores, and one in Tamil Nadu with potential revenue of 70 crores. These capacities contributed ~56 crores in FY22 (25% capacity utilisation). The units are getting ramped up rapidly with plants operating at a utilization level of 90%+ (peak revenue: 220 crores)
The company plans to invest ~₹280 Crores on various new initiatives, on the existing, ongoing projects in the next two years. The company invested ₹51 Cr during the first half of the year for capacity expansion and business growth. These investments are expected to increase revenue and improve operational productivity in FY24 and beyond.
As envisaged in the company’s overall business plan, the company has added three new production units during the year, two in Karnataka (Tumkur and Bommanahalli) and one unit in Tamil Nadu (Krishnagiri). Production currently operating at peak utilization levels with a steady order book for the next quarter. Charted out CAPEX of 350+ crore over the next four years (by FY25E) which will have the potential to generate incremental revenues worth ~1300 crore
All three units are expected to add about 12% of the total production capacity of the company if operating at the optimum level. Further, the company also has incorporated a wholly owned subsidiary in UAE to channel overseas investment projects and efficiently service international customers.
Currently, the company has a 36 million Annual Capacity (garments per year). 3 million Monthly Capacity (garments per month). 3 new units were commissioned in FY22.
The company is gradually making a shift towards high-value business. This is also visible in the realization per piece trend over the last 5 years.

Margin Improvement
Change in management has been able to improve operating margins. Since the company is into finished garments, it commands a high margin (value added in nature) The turnaround has just begun, and with an uptick in the textile industry, the company will be able to perform well in the coming years.

Additional capacity in knits for backward integration
The company plans to augment production capacities in the new line of business in other territories of India as well. To manage the new business segment, the company has incorporated a new wholly-owned subsidiary to carry out business in the Knits segment.
The company has taken possession of 10 acres of land for the fabric processing unit in SIPCOT, Perundurai, Tamil Nadu, and the registration of the building and machinery for the unit completed. Expected CAPEX will be to the tune of ~Rs 1bn in the next 12 months. The company has also received the In-principal sanction for the necessary credit lines for banks.
Three new capacities were added in FY22, enhancing the total capacity by 12%
The company commissioned three new production units in FY22, two in Karnataka (Tumkur and Bommanahalli) and one unit in Tamil Nadu (Krishnagiri). All three units are expected to add about 12% of the total production capacity of the company if operate at an optimum level.
The company has enhanced its capacity by adding a leased unit at Tumkur This will aid the capacity expansion plans as envisaged in the company’s overall business plan. The unit is expected to add 4.5% of capacity. The company leased another manufacturing unit at Bommanahalli, Bangalore, and commenced its commercial production This will cater to woven and knit segments. The new unit is expected to add another 4.5% production capacity
What makes Gokaldas export attractive?
The company is in the perfect combination of textile treasure: Exports + Restructuring + largest apparel exporter
Exports help in de-risking concentration across geographies. With the vaccination drive gaining momentum in all the countries that the company exports to, they expect good demand recovery. This is already being reflected in the strong order book for the quarters ahead.
Change in Management
The company appointed a new MD in 2017. With certain measures taken like augmenting the supply chain, making the process more effective, reducing employee attrition, reducing wastage, and timely delivery, the company made a turnaround in 2019. Scaling up the capacity - Incremental revenue will come up at incrementally higher profitability
The incremental revenue will come at incrementally higher profitability not all fixed cost, scale-ups so capacity expansion in the existing factories itself by adding more lines will come at much higher profitability.
The factory EBITDA itself runs at about 5% higher than the overall EBITDA. So, incremental revenue will come at a higher EBITDA which will automatically give margin inflation as they keep expanding the business
Given the order book, the company is actively looking at ramping up incremental capacities at existing units by adding more lines. The company has already panned out the entire CAPEX for next 2-3 years.
Changes in the supply chain after the crisis.
China+1 Strategy
Various discussions with industry people say that after the pandemic there is a structural change visible in the industry working. Decentralization as a theme is playing out in the industry after the crisis. China +1 strategy is not just confined to China but is used in various other strategies.
Buyers are not keeping it set to one place region-wise. No one country in the company’s sourcing list will occupy a larger share. For instance, for an apparel sourcing company, Bangladesh was a major supplier but now they will source from other countries like India too.
Buyers want strategic vendors so there are consolidating their vendor base. Both, on the buyer and supplier side, a lot of companies are getting wiped out, so both sides are shrinking a little bit. Demand has dropped, so the tail-end suppliers have been removed from a lot of buyer’s vendor lists. This will lead to a gain in market share by the leading large players in the industry.
New opportunities across the Supply Chain
The idea of partnering with brands and retailers. For instance, Shahi Exports is in conversation with one of their biggest customers to set up a manufacturing unit in the US together. Walmart is asking interested strategic suppliers to set up units in the US.
For instance, H&M sources from 71 suppliers in India. Any consolidation in the vendor list of H&M means the elimination of small and tail-end suppliers. This will lead to a gain in share by the larger companies.
Change in Trends
Fast Fashion has become a buzzword in the fashion industry - Fast fashion is a design, manufacturing, and marketing method focused on rapidly producing high volumes of clothing. Stores like Zara and H&M, two of the largest retailers in the world, still hold a stronghold over most people’s shopping habits. These cheaply made, trendy pieces have resulted in an industry-wide movement towards overwhelming amounts of consumption.
Co-location and Proximate Sourcing - Where there’s cotton, there’s a mill. By working with vendors who cut and sew garments in the same country where raw materials are grown and processed – known as co-location-the transit time between mills and garment vendors reduces. India has an advantage here.
Similarly, proximate sourcing refers to the proximity between the manufacturing country and the final retail destination.
If India signs an FTA with EU- The market opportunity size for India will increase tremendously in this regard, the Apparel Export Promotion Council (AEPC) had said that India’s apparel exports could double in three years if disadvantages in the trade agreements are eliminated. Also, a new market would open for home textiles too.
There are headwinds and tailwinds for global trade, and apparel is no exception. While no one can predict the events that will unfold, we remain cautiously optimistic. Several forces are at work to create both opportunities and risks in the year ahead.
Some of the opportunities are continuing shift of global sourcing away from China, supplier consolidation towards efficient and well-capitalized players, supply-side instabilities in countries like China, Vietnam, and Sri Lanka, strengthening Dollar, the announcement of PLI, and signing of FTAs with key markets..
Management Insights from the Conference Call
As per management, there are several opportunities available due to the continuous shift of global sourcing away from china. In the short term, there are headwinds but good growth opportunities in FY23 & FY24.

As per management, there is a revenue inflow expectation of around 500 crores of toplines by the aligned CAPEX from these 2 units.

Management believes that they will start seeing some traction. So, it's not from product mix change or ASP growth, but it's just the volumes, which will drive Q4. The business that comes out of China and Vietnam them, that's more structurally viable long term, and that's what will drive growth in India.

There is a huge expectation for growth opportunities from India. The company is one of the strong suppliers, has high-quality compliance, and is a very strong competitor in that sense. They would like to see more people like them players. So, there is room for many more to exist in the country. As good as anybody in the country, the company is even compared with the international players. So they are very favorable with respect to players in other countries like Bangladesh, China, Cambodia, and all that.
With the management guidance of revenue growth
So, the company has seen reasonable traction, which is the reason why in the second quarter, they had a 29% growth while the Indian apparel industry had a decline of 6.3% in exports. So, it all depends on which markets they focus on and what product category they focus. The company also had the good fortune of having a diversified set of customers. which allows them to feet from one customer to another to make sure that their order book is reasonably intact.
Management said, “ we've seen that Q3 could be a kind of challenge given that the inventory overhang in the U.S. market is at its highest for spring which is when we produce for -- which is what we produced in the third quarter. Also, the European market is exceptionally weak given the high inflation and war scenario there. and the markets in China are also quite weak from a demand perspective.
So given all of this, our choice of market, which is the United States, which has been reasonably resilient, has been good. We have an order book which is reasonably good for the third quarter. We are confident of coming as fast with last year's revenue for the third quarter and hopefully start growing post that even better in the fourth quarter.
When I look at the quarter ahead, which is the fourth quarter, that is when we will be producing for summer of 23%, which is almost a year away. And if you look at this summer, the summer of '22, it was warm and it was long. The sales were good, especially for woven products. And I believe that if global warming is here to stay, then next summer would also be long and formed and we would have the retailers would have low inventory, which would mean that reasonably good demand situation for us.
So I'm encouraged by certain seasonal cues, weather use, etcetera, global macroeconomic stability is instability is beyond. And we hope that we will be able to navigate whatever uncertain times come in front of us, we have done that either do, and we are confident that we will do our best to handle any situation or any adverse situation that may come our way. ”
Serving marquee global brands for over decades
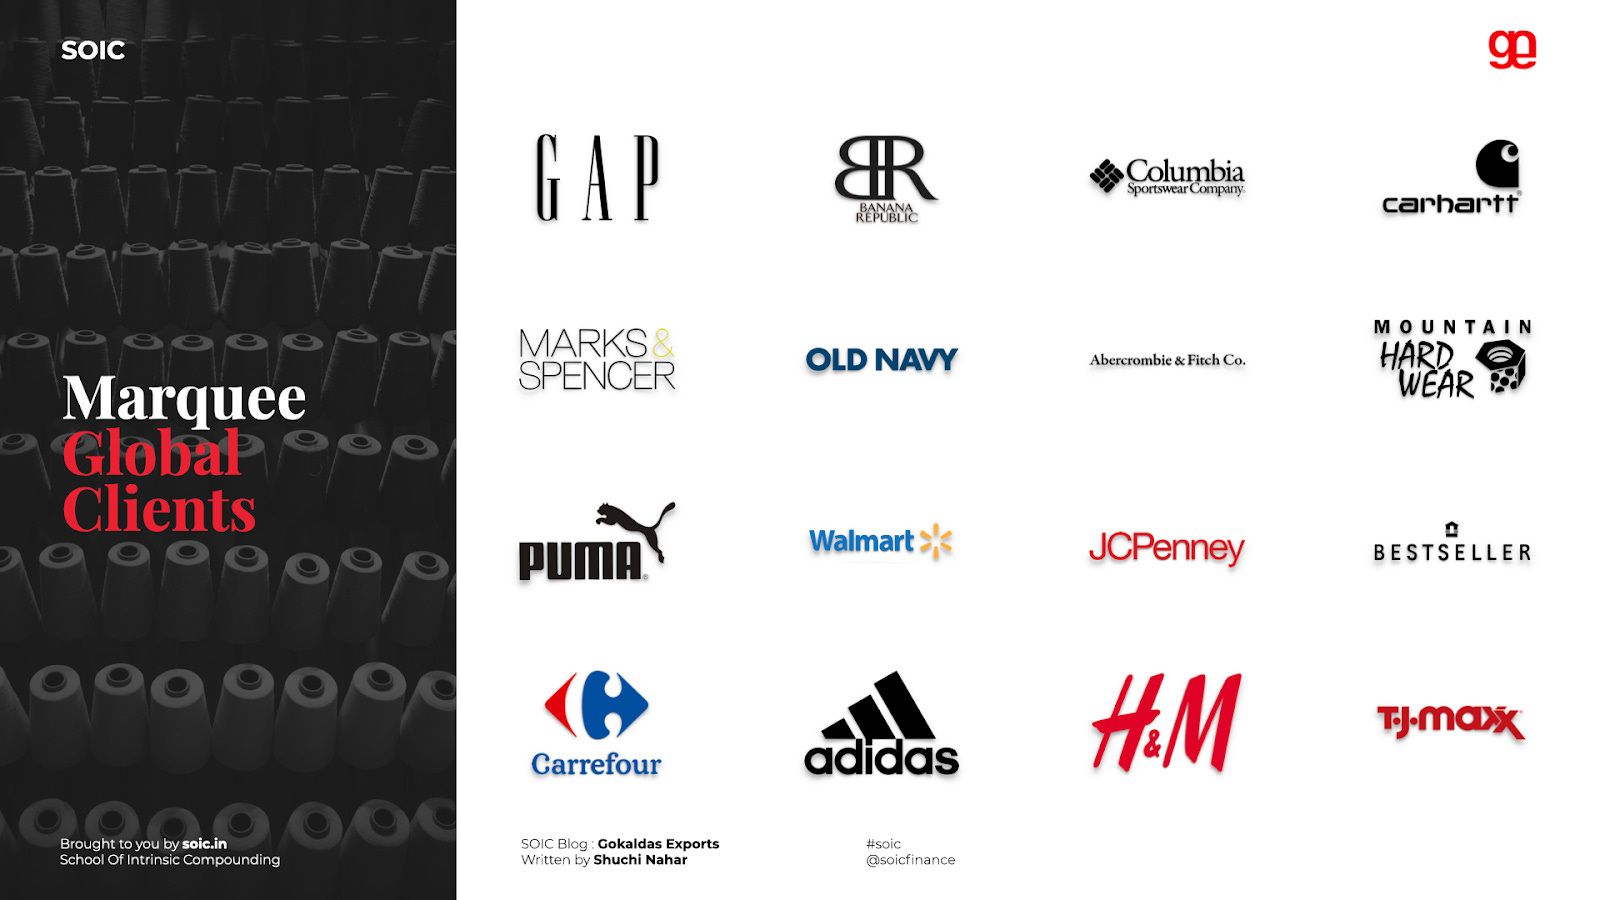
Over the last five years, the company has successfully worked towards growing its customer base, which has resulted in enhanced share of contribution to the revenue. Top 5 customers, who contributed a mere 1.8% of revenue in FY18, have now increased to 15% in FY22. During this period, the company was under pressure to meet the growing demand of all its customers and had to judiciously allocate capacity to ensure all-round customer satisfaction. The company will onboard more customers in FY23, as it continues to leverage the China+1 narrative in the US and European markets.
Over the years, it has significantly increased the number of its high-value high-margin clients, as it made efforts to expand the share of its outerwear garments within its revenue stream. We expect this trend to continue, in line with revenue growth and capacity addition.

Management change bringing in stable growth and experienced personnel
Management team has been stable since FY18, when Mr. Sivaramakrishnan Ganapathi took charge as the CEO and Mr. Sathyamurthy A as the CFO. The new management team has taken various bold and tactical decisions in the last four years that has yielded positive results for the company.
Right from its operations (factories pruned to 19 in FY22 from 22 in FY18), improving realization levels, paying down debt, improving cost efficiency and customer relations were some of the key steps taken. These measures resulted in a revenue CAGR of 15% over FY15-22.
In FY17 and FY18 the company reported EBITDA loss, after which period it did not report a single year of loss. Management’s commitment and diverse experience have enabled the company to position itself as one of the leading apparel exporters in India, with a strong client base and order book. As per management, 25% of the orders booked by brands in India are booked at the company.
Risk
Key management personnel risk
Changes in labor laws and lack of manpower due to strikes and socioeconomic and political factors
Delay in commissioning new facilities and modernization plans
Currency fluctuation and geopolitical challenges in import markets
Geographical risk arising from high client concentration in the US
Retail slowdown
Inventory stocking
US slowdown & Recession situation worldwide
Peer comparison with one of the largest garments producing company – Shahi Exports (Unlisted player)
Established in 1974 by Mrs. Sarla Ahuja, Shahi has grown to become India’s largest apparel manufacturer, operating more than 50 factories and 3 processing mills across 9 states. They have over 113,000 employees, including 77,000 women. They are committed to serving our customers through design-led innovation, vertically integrated operations, and positive social and environmental business practices.
Let’s compare the financials for both companies for a better understanding of business, margins, and costs.

Financials of Gokaldas Exports. Source: Screener
Net profit margin for both companies lies around 3-7%. Margins are suppressed due to a continuous rise in cotton prices. Companies are now focusing on passing on the increase in material cost to customers via price hikes in finished goods. However, they are not able to pass it on fully, given the current demand-supply scenario.
Textile is facing headwinds and muted demand. The same is likely to continue in the near term. The gross margin pressures are expected to sustain till the next cotton season. For Investors here is a wait-and-watch scenario till the next 5-6 quarters.
Outlook
Better product mix to drive margins
Company posted EBITDA losses in FY17 and FY18, after which it changed its management in FY18. The new management successfully turned around the fortunes of the company, evident from the 550bp improvement in its EBITDA margin to 10.3% in FY22 from 4.8% in FY19, primarily through lower wastage and operating leverage.
Gross margin increased from 48% in FY18 to 50.4% in FY22, led by a change in product mix and smart sourcing of raw materials. With management further improving its product mix in favor of high-value high-margin products, it’s estimated that the gross margin can touch 51.5% by FY25E.
As on H1FY23, GEL incurred CAPEX of 51 crores and maintained its guidance for incurring CAPEX worth 160 crores in FY23E. The majority of CAPEX is towards setting up a new greenfield unit in Madhya Pradesh (phase 1 potential revenue -160 crore with 2.5-3 million pieces from phase 1) and backward integration in fabric processing for knitted garments (currently revenues are dominated by woven segment).
The MP capacity is expected to come on stream by Q4FY23 (pilot orders), with commercial production to begin from Q1FY24 onwards (volumes: 2.5- 3 million pieces). Also, the commissioning of fabric processing capacity for knitting to start from Q1FY24 (CAPEX - 100 crore).
The company may invest another 35-40 crore towards establishing new downstream units to produce knitted garments or may engineer existing downstream capacity in the near term. Both these projects have the potential to generate ~500 crore revenues. Capex for FY24E worth 130-140 crore could be deferred owing to a challenging demand scenario in export markets.
On the outlook front, the company expects a slowdown in the order book for spring production (Q3FY23) owing to excess inventory of the previous year at the retailer’s level in the US and Europe. Early trends indicate Q3FY23 revenues to be like that of Q3FY22 (520 crore).
With gradual inventory re-stocking for the summer collection, the company expects a gradual pick-up in orders from Q4FY23 onwards. Because of better than anticipated H1FY23 performance, we revise our revenue estimate upwards by 6-3% for FY23- 24. Despite expected near-term headwinds, given the robust opportunities in the apparel export space, we believe GEL has a long runway for growth. We build in revenue CAGR of 19% in FY22-24E.
The company tries to protect its gross margins as it endeavors to pass on almost entire price hike to customers and tends to factor in current prices while booking the order. On a sequential basis, gross margins improved 70 bps YoY to 46.1% (down 385 bps YoY) in Q2FY23. Enhanced productivity and cost control measures have resulted in GEL maintaining double-digit EBITDA margins (11-12%).
Absolute EBITDA grew 26% YoY to 65.3 crores (down 10% QoQ). EBITDA margins to be under pressure owing to a slowdown in revenues (negative operating leverage) and pre-operating expenses. We expect EBITDA margins to soften by 90 bps YoY to 10.6% in FY23E. Better productivity and higher operating efficiencies in FY24 are expected to lead GEL to report an EBITDA CAGR of 20% in FY22-24E.
With enhanced working capital management (generated OCF worth 305 crores in H1FY23, NWC days reduced to 57), the company continues to strengthen its balance sheet with a net cash surplus of 369 crores (FY22 - 119 crore). It’s expected that the company will generate positive OCF in FY23 despite increased working capital and CAPEX requirements in H2FY23. With an expectation, the company will manage to maintain a RoCE of ~20% owing to prudent working capital management (NWC days - 65 days) and decent asset turn (~4.5x).
Disclosure: Nothing on this website should be construed as investment advice. Please consult your financial advisor. We are not SEBI registered Analysts/Advisors. We are not accountable for any loss or gains that might occur to you from this or any analysis on the website. The author and SOIC do not hold the stocks in their portfolio at the date this post was published.